Interactive demo

Watch it build the analysis, step by step.

This is the real add-in working a live P&L - reading your sheet, building the variance bridge, and writing the forecast. Click through it, or let it run.
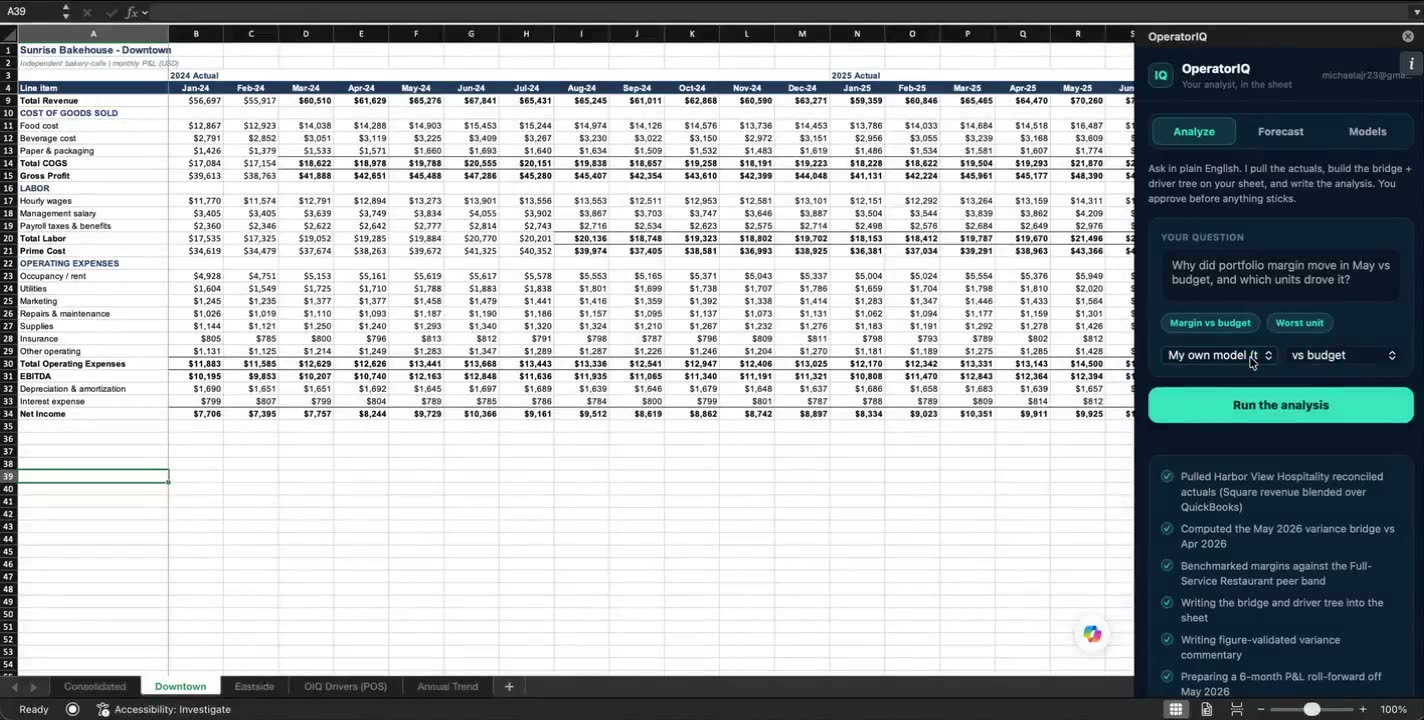
OperatorIQ · Microsoft Excel
Your P&L, in Excel
Step 1 of 6
Your P&L, in Excel

Start from the model you already built. Ask in plain English - no new tool to learn.

What it produced

The analysis it wrote - read it yourself.

The actual output from that run on the Sunrise Bakehouse P&L. Real numbers, real commentary - every figure owned by the engine, validated against the model. Nothing here was invented.

Variance bridge · P24 vs budget
$10,065Budget-$2,126Revenue+$784COGS+$673OpEx$9,396Actual
OperatorIQ's analysis

P24 net income was $9,396, behind budget by $669, with net margin down 0.5 points to 14.2%.

  • Revenue hurt by $2,126 vs budget; a P&L alone cannot split this into covers vs average ticket, so pull the POS daypart and cover detail to isolate the driver.
  • COGS helped by $784, operating expenses helped by $673 vs budget.
  • All tracked lines sit within the Bakery / Specialty Food healthy benchmark ranges.

Action: review the revenue line - it moved $2,126 against budget this month.

Benchmarked vs peer band
Food cost
22.7% of revhealthy vs 28-35%
Hourly wages
20.7% of revhealthy vs 22-28%
Payroll taxes & benefits
4.3% of revhealthy vs 22-28%
12-period forecast · off P24
Base / mo
$65,470
Growth / period
0.41%
COGS %
30.6%
Revenue
$807K
EBITDA
$116.6K
Margin
14.4%
OperatorIQ's analysis

Baseline projects $807K revenue and $116.6K EBITDA over 12 periods at 0.4% per-period growth. COGS sits at 30.6% (within 28-35%) and net margin at 14.4% (within 8-15%).

Each line is a live formula off editable blue inputs - change one and the model recomputes.

See it run

Every loop, in motion.

Real screen capture of the add-in working - variance, forecast, cash flow, and the model of record. No edits, no mockups.

OperatorIQ · ExcelThe difference
The model of record

Save the sheet as a version. Next cycle, save again - and OperatorIQ shows you exactly what changed and why, with the full history behind it. This is the thing Excel never had: your model, versioned and accountable.

OperatorIQ · ExcelVariance
Variance, built in your sheet

It reads the actuals, writes the bridge and driver tree as formulas off your own cells, and benchmarks every line.

OperatorIQ · ExcelForecast
The forecast, off your actuals

A 12-period P&L roll-forward - live, editable blue inputs, every cell a formula.

OperatorIQ · ExcelCash flow
A 13-week cash flow

Receipts, disbursements, and ending cash projected out 13 weeks from the same model.

OperatorIQ · ExcelLive
Change an input, it re-runs

Edit a blue assumption cell and the whole model recomputes in the sheet - nothing is hard-coded.

OperatorIQ · ExcelAudit
Every change, on the record

A running trail of what changed, when, and why - the audit story finance teams never had in Excel.

This is the add-in, on your model.

No demo data, no rebuild - it works on the Excel P&L you already have. Free for one analyst, install in minutes.

Start free  →Talk to us

Looking for the operator dashboard demo? See it here →